Examples
Basic Example
import smdc_perftests.performance_tests.test_cases as test_cases
import time
import numpy as np
# use measure decorator to run function multiple times
# and measure execution time of each run
# the returned results gets the name given in
# the decorator but can be changed later if necessary

@test_cases.measure('experiment', runs=50)
def experiment(sleeptime=0.01):
    time.sleep(sleeptime+np.random.rand(1)*sleeptime)

result1 = experiment()
result2 = experiment(0.05)
result2.name = "sleep 0.05"
result3 = experiment(0.011)
result3.name = "sleep 0.011"

# the results can be printed
print result1
print result3
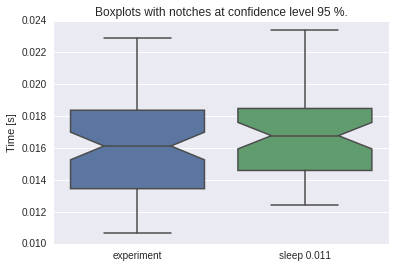
Results experiment
50 runs
median 0.0158 mean 0.0157 stdev 0.0029
sum 0.7859
95%% confidence interval of the mean
upper 0.0165
       |
mean  0.0157
       |
lower 0.0149

Results sleep 0.011
50 runs
median 0.0158 mean 0.0163 stdev 0.0034
sum 0.8168
95%% confidence interval of the mean
upper 0.0173
       |
mean  0.0163
       |
lower 0.0154
# the results can also be compared based on the 95% confidence intervals.

print result1 < result2
print result2 < result1
print result1 < result3
True
False
False
# or then plotted as boxplots
import smdc_perftests.visual as vis
import matplotlib.pyplot as plt
%matplotlib inline

fig, axis = vis.plot_boxplots(result1, result3)
plt.show()
Example with Dataset
import smdc_perftests.performance_tests.test_runner as test_runner
import time
import datetime as dt
import numpy as np
# define a fake Dataset class that implements the methods
# get_timeseries, get_avg_image and get_data

class FakeDataset(object):

    """
    Fake Dataset that provides routines for reading
    time series and images
    that do nothing
    """

    def __init__(self):
        pass
        self.ts_read = 0
        self.img_read = 0
        self.cells_read = 0

    def get_timeseries(self, gpi, date_start=None, date_end=None):
        time.sleep(0.01*np.random.rand(1))
        self.ts_read += 1
        return None

    def get_avg_image(self, date_start, date_end=None, cell_id=None):
        """
        Image readers generally return more than one
        variable. This should not matter for these tests.
        """
        assert type(date_start) == dt.datetime
        self.img_read += 1
        time.sleep(0.01*np.random.rand(1))
        return None, None, None, None, None

    def get_data(self, date_start, date_end, cell_id):
        """
        Image readers generally return more than one
        variable. This should not matter for these tests.
        """
        assert type(date_start) == dt.datetime
        assert type(date_end) == dt.datetime
        self.cells_read += 1
        time.sleep(0.01*np.random.rand(1))
        return None, None, None, None, None
fd = FakeDataset()
# setup grid point index list, must come from grid object or
# sciDB
# this test dataset has 10000 gpis of which 1 percent will be read
gpi_list = range(10000)

@test_runner.measure('test_rand_gpi', runs=100)
def test_ts():
    test_runner.read_rand_ts_by_gpi_list(fd, gpi_list)

result_ts = test_ts()

print result_ts
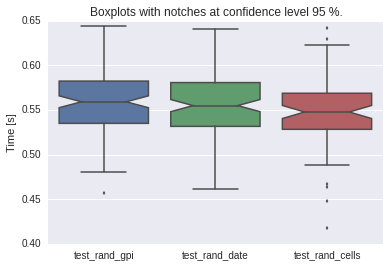
Results test_rand_gpi
100 runs
median 0.5642 mean 0.5591 stdev 0.0334
sum 55.9069
95%% confidence interval of the mean
upper 0.5657
       |
mean  0.5591
       |
lower 0.5524
# setup datetime list
# this test dataset has 10000 days of dates of which 1 percent will be read
date_list = []
for days in range(10000):
    date_list.append(dt.datetime(2007, 1, 1) + dt.timedelta(days=days))

@test_runner.measure('test_rand_date', runs=100)
def test_img():
    test_runner.read_rand_img_by_date_list(fd, date_list)

result_img = test_img()
print result_img
Results test_rand_date
100 runs
median 0.5530 mean 0.5548 stdev 0.0343
sum 55.4800
95%% confidence interval of the mean
upper 0.5616
       |
mean  0.5548
       |
lower 0.5480
"""
Read data by cell list using fixed start and end date
1 percent of the cells are read with a minimum of 1 cell.
"""
fd = FakeDataset()
cell_list = range(10000)

@test_runner.measure('test_rand_cells', runs=100)
def test():
    test_runner.read_rand_cells_by_cell_list(fd,
                                             dt.datetime(2007, 1, 1), dt.datetime(2008, 1, 1), cell_list)

results_cells = test()
print results_cells
Results test_rand_cells
100 runs
median 0.5510 mean 0.5476 stdev 0.0368
sum 54.7624
95%% confidence interval of the mean
upper 0.5549
       |
mean  0.5476
       |
lower 0.5403
import smdc_perftests.visual as vis
import matplotlib.pyplot as plt
%matplotlib inline

fig, axis = vis.plot_boxplots(result_ts, result_img, results_cells)
plt.show()
Example of running the test suite and analyzing the results
import os
from datetime import datetime
from smdc_perftests.performance_tests import test_scripts
# the test_scripts module contains the function
# run performance tests which runs all the performance tests on a dataset

# in this example we will use the esa cci dataset class
from smdc_perftests.datasets.esa_cci import ESACCI_netcdf
from smdc_perftests import helper
#init the esa cci dataset
fname = os.path.join("/media", "sf_H", "Development", "python",
                     "workspace",
                     "SMDC", "SMDC_perftests", "tests", "test_data",
                     "ESACCI-2Images.nc")
# only read the sm variable for this testrun
ds = ESACCI_netcdf(fname, variables=['sm'])
# get the testname from the filename
testname = os.path.splitext(os.path.split(fname)[1])[0]

# generate a date range list using the helper function
# in this example this does not make a lot of sense
date_range_list = helper.generate_date_list(datetime(2013, 11, 30),
                                            datetime(2013, 12, 1),
                                            n=50)

# set a directory into which to save the results
# in this case the the tests folder in the home directory
res_dir = "/home/pydev/tests/"
# run the performance tests using the grid point indices from
# the dataset grid, the generated date_range_list and gpi read percentage
# of 0.1 percent and only one repeat
test_scripts.run_performance_tests(testname, ds, res_dir,
                                   gpi_list=ds.grid.land_ind,
                                   date_range_list=date_range_list,
                                   gpi_read_perc=0.1,
                                   repeats=1)
reading 245 out of 244243 time series
reading 1 out of 50 dates
reading 1 out of 50 dates
This creates the following files named using the name given to the test and the name of the test function that was run.
!ls /home/pydev/tests
ESACCI-2Images_test-rand-avg-img.nc    ESACCI-2Images_test-rand-gpi.nc
ESACCI-2Images_test-rand-daily-img.nc
Visualization of the results
%matplotlib inline
import glob
import smdc_perftests.performance_tests.analyze as analyze
# get all the files in the results folder
fs = glob.glob(os.path.join(res_dir, "*.nc"))
df = analyze.prep_results(fs)
# this returnes the mean times at the moment
print df
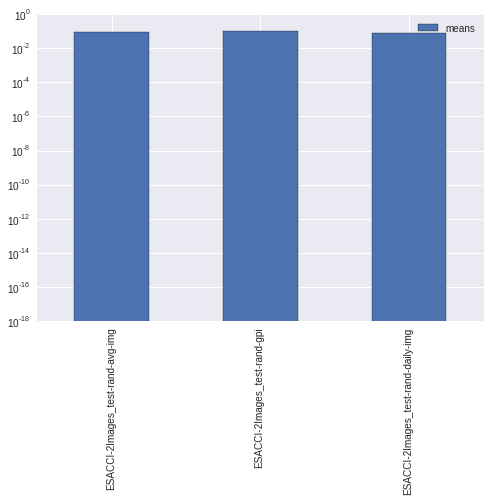
# and makes a very simple bar plot
ax = analyze.bar_plot(df)
                                       means
ESACCI-2Images_test-rand-avg-img    0.085946
ESACCI-2Images_test-rand-gpi        0.098265
ESACCI-2Images_test-rand-daily-img  0.059122